Project 02 · Integrated Marketing & Performance Analysis
FUSO Egypt
A multi-year read of Mitsubishi FUSO Egypt’s social presence: how its Facebook content evolved from product-led to brand-led between 2022 and 2024, and how Facebook, YouTube and TikTok performed in 2025 and 2026.
Main findings
- Facebook views, 20259.8M
- Content interactions, 202547.4KUp 226.3%
- Messaging conversations, 20253.3KUp 261.2%
- Facebook follows, Jan–Aug 2026 vs 2025+1,303%
Overview
The report is built around FUSO Egypt’s Facebook page, supported by YouTube and TikTok analysis. It starts with a content review (2022–2024), then moves into performance: what drove views, interactions, leads and customer conversations, and where attention was not turning into contacts.
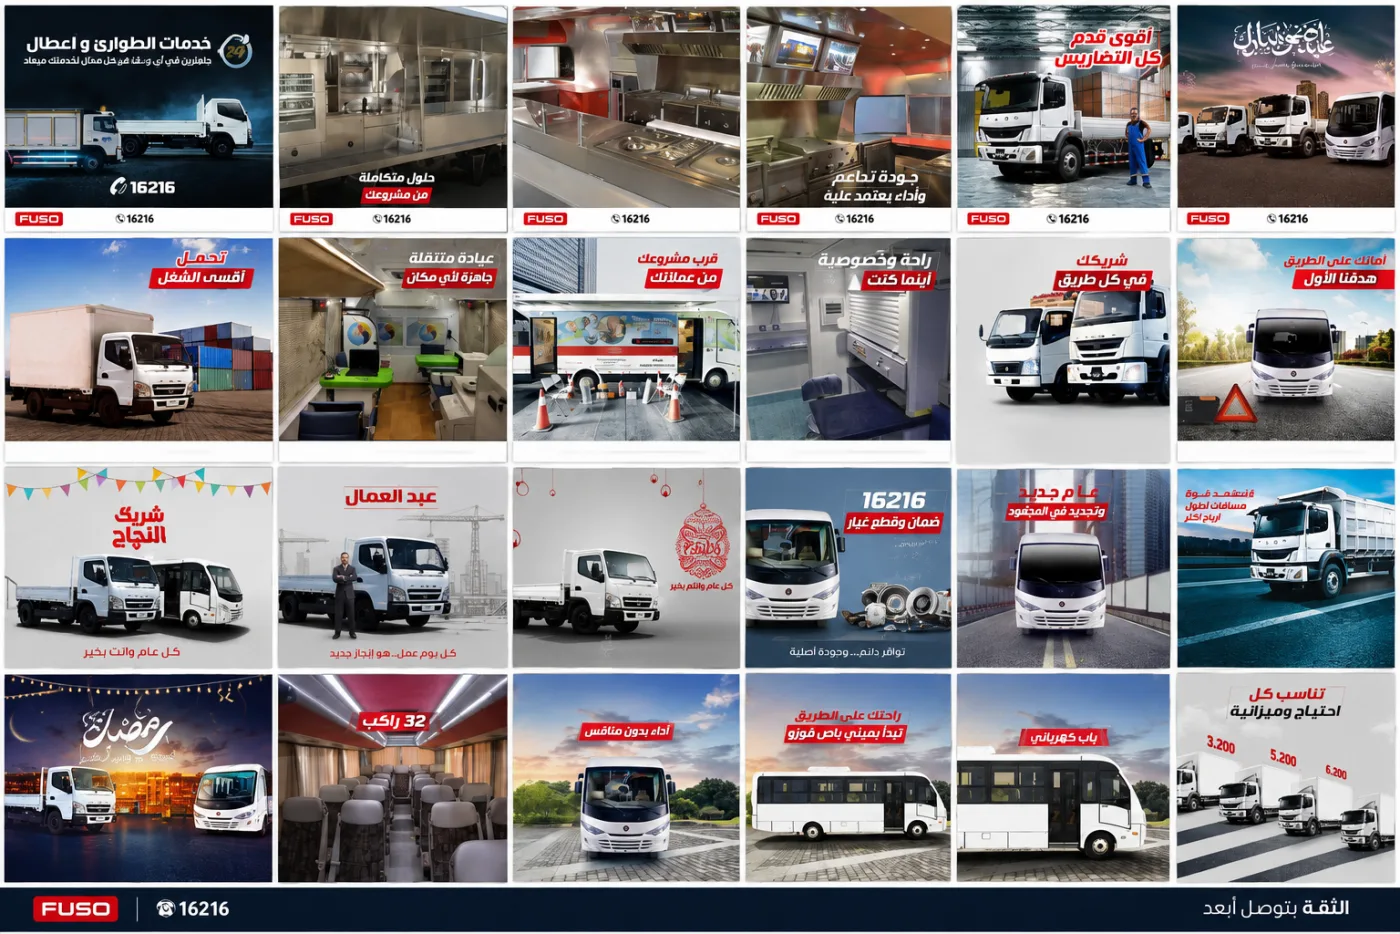
The 2022 communication was functional, product-led and B2B-oriented; by 2024 it had become more diversified and brand-oriented. Performance reporting begins in 2025, when video and paid distribution became the main growth drivers.
Content evolution, 2022–2024
2022 · Product-led
- Product & performance: specifications, power, torque, safety and comfort
- Business applications: mobile kitchens, medical units, transportation
- Aftersales & service: genuine parts, roadside assistance, the 16216 hotline
- Seasonal communication
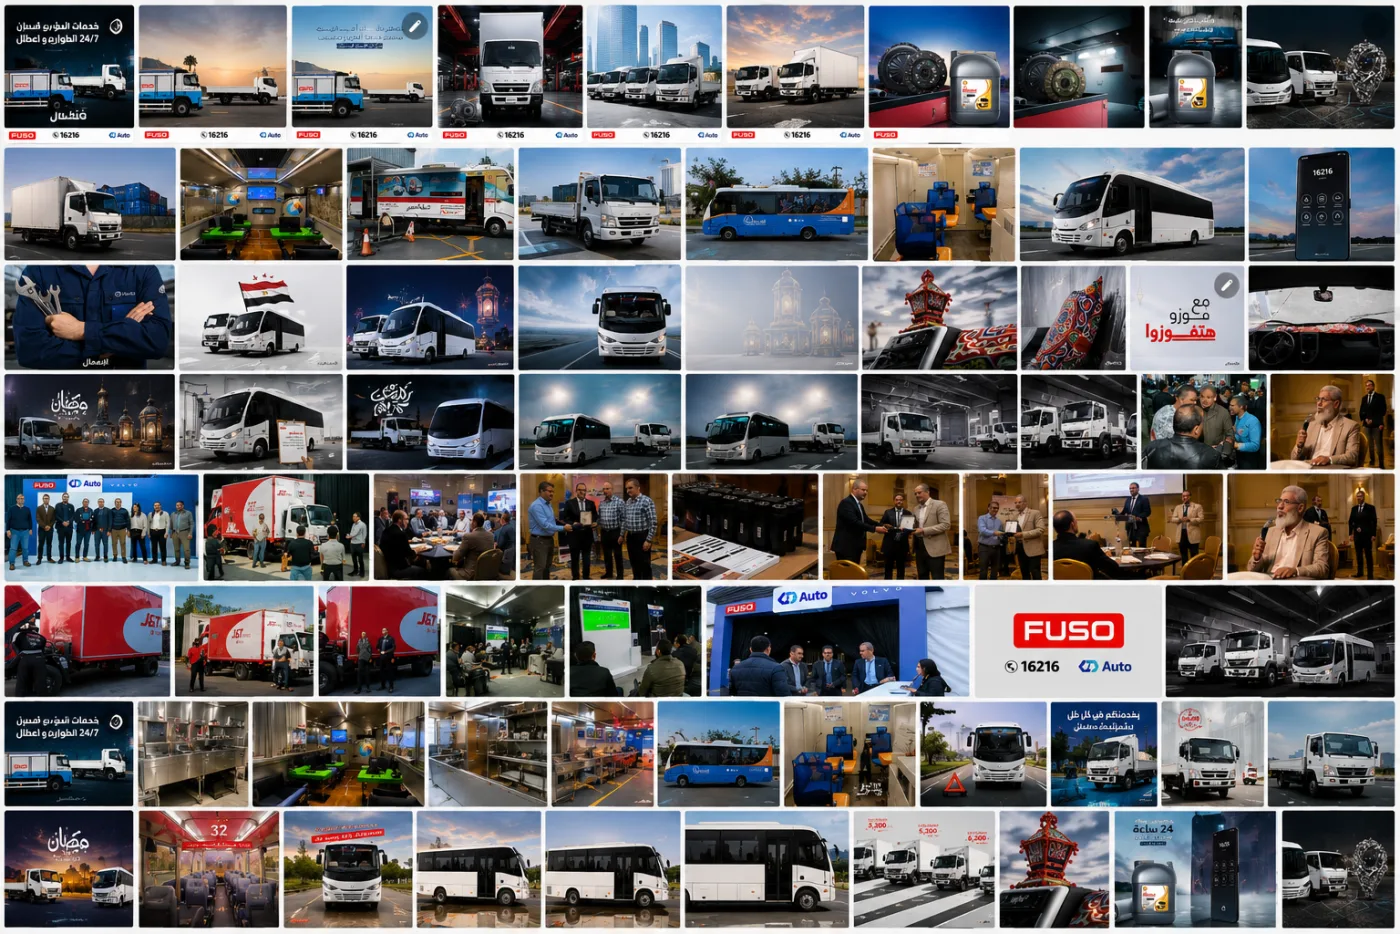
2023 · Expanded communication
- Business solutions: customised vehicles and applications
- Aftersales & support: 24/7 roadside assistance, parts, lubricants
- Partnerships & events: collaborations, exhibitions, corporate activity
- Seasonal & cultural content
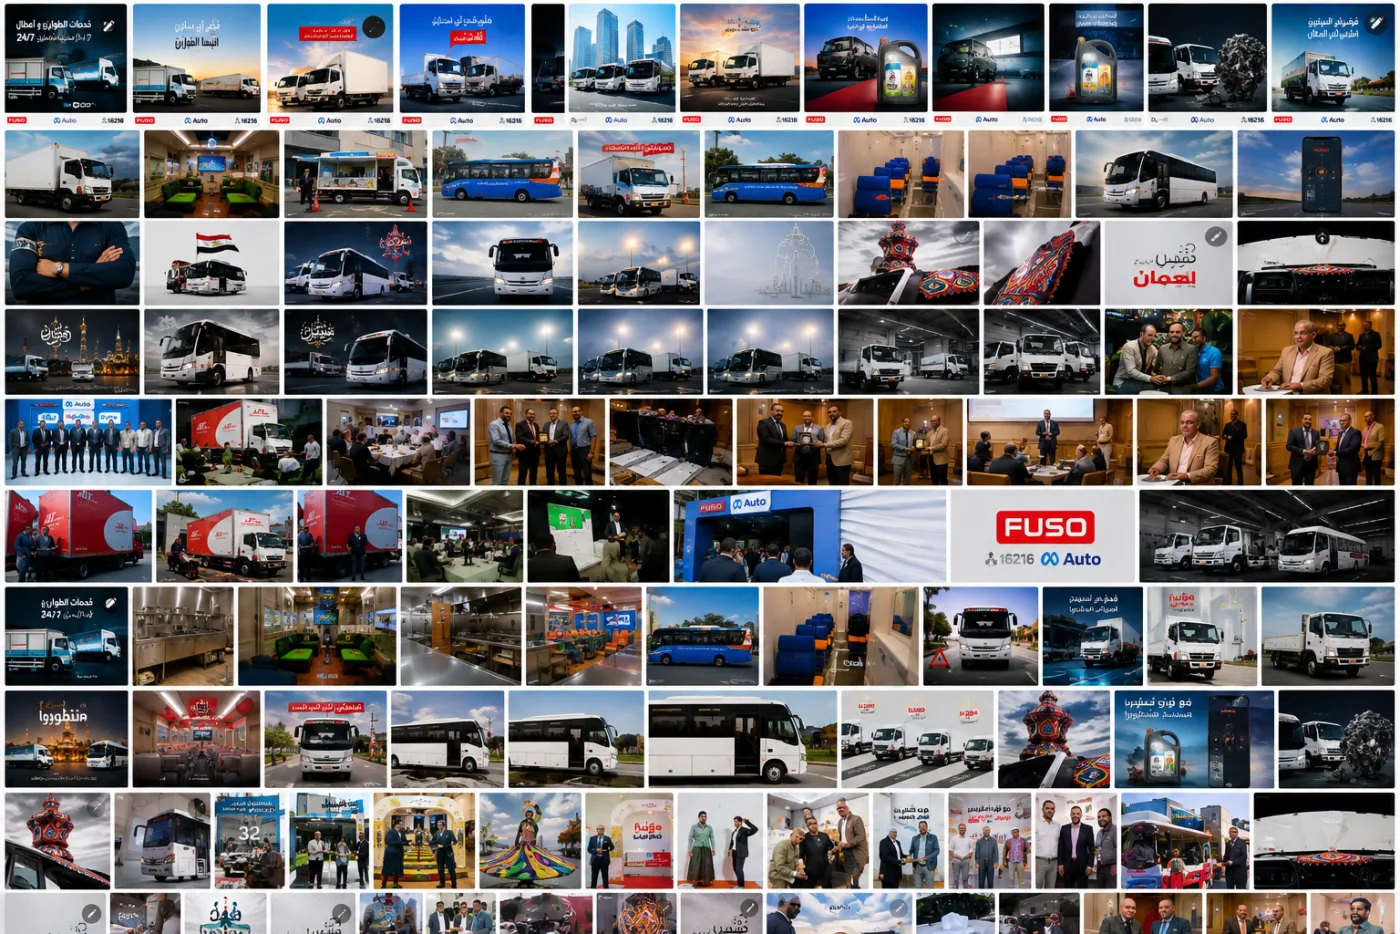
2024 · Brand & engagement
- Product & business solutions
- Events & partnerships: brand activations and customer engagement
- Customer & corporate engagement
- Cultural & brand content: Ramadan and Egyptian cultural moments
Across the three years the creative stayed anchored in a consistent red/white FUSO identity, but widened from vehicle-focused visuals to event photography, people-focused content and lifestyle imagery.
Facebook performance, 2025
Figures from the 2025 Facebook report. Changes are as shown in the report.
- Views9.8M
- Content interactions47.4KUp 226.3%
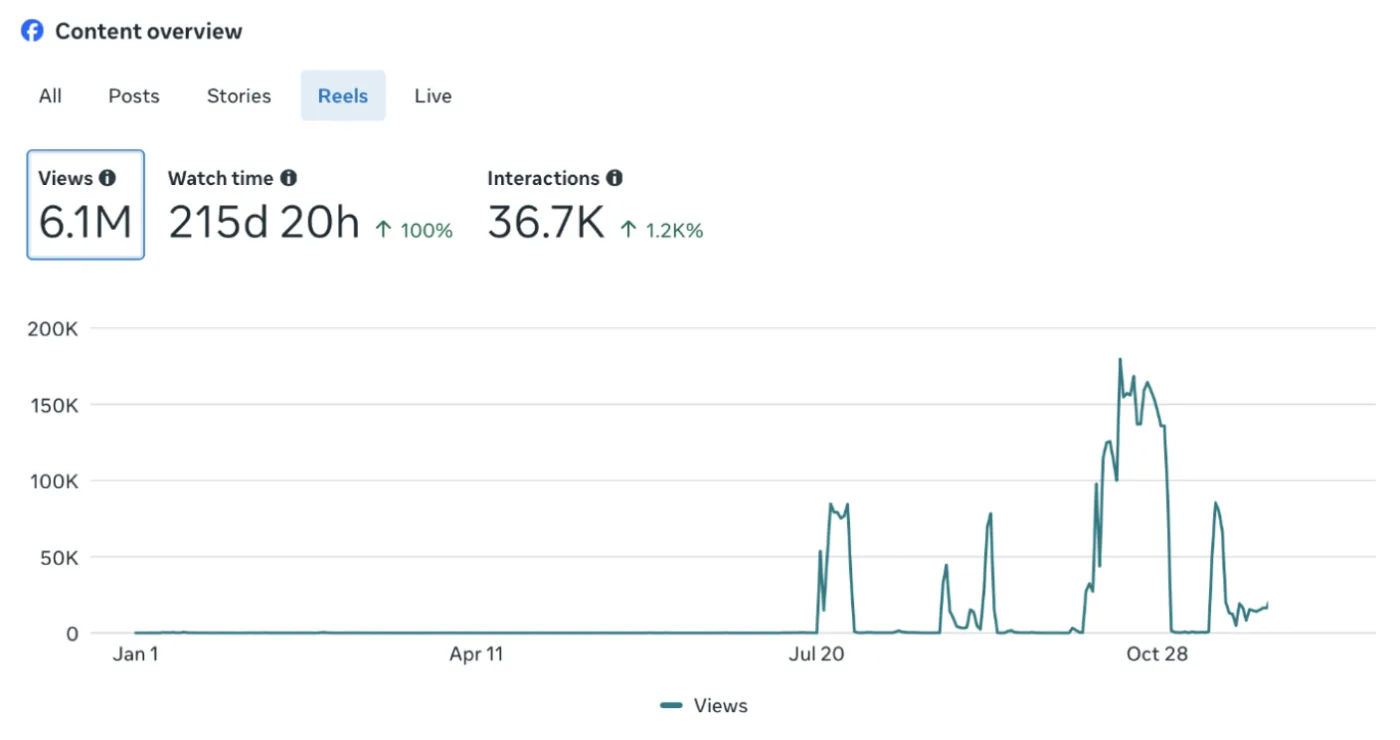
- Reels views6.1M
- Intake leads2.4KUp 13.1%
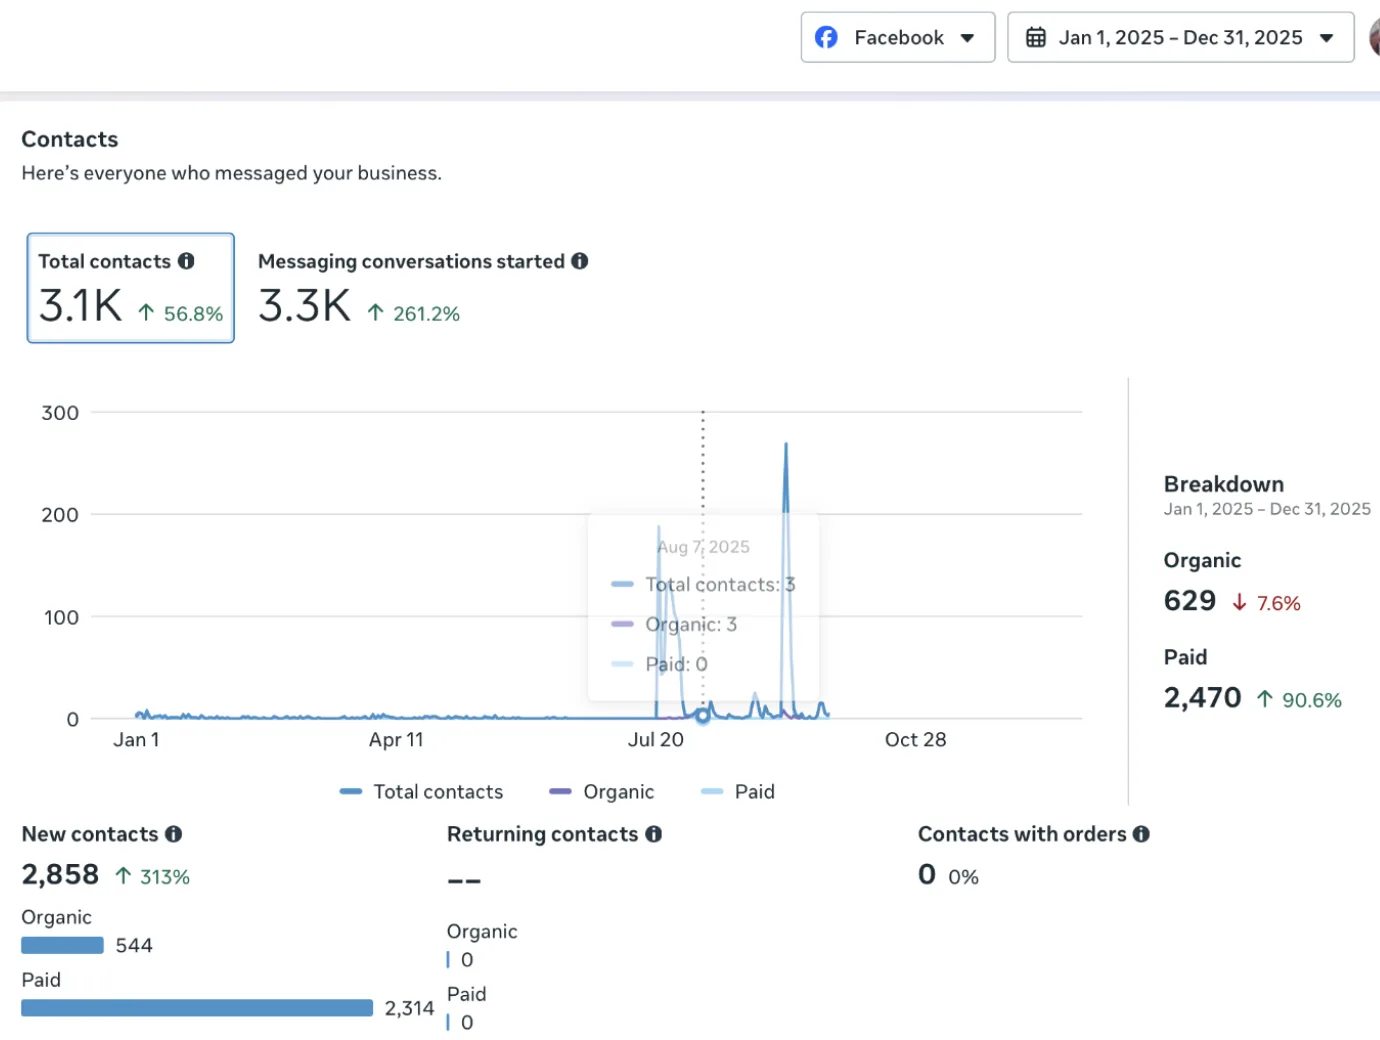
- Total contacts3.1KUp 56.8%
- Messaging conversations3.3KUp 261.2%
Reels led on both views and interactions
| Format | Views | Interactions |
|---|---|---|
| Reels | 6.06M | 36.7K |
| Links | 2.21M | 4.4K |
| Multi-photo | 991K | 2.8K |
| Photo | 581K | 2.8K |
Customer acquisition was driven by paid activity
| Contacts | 2025 | Change |
|---|---|---|
| New contacts | 2,858 | +313% |
| Paid contacts | 2,470 | +90.6% |
| Organic contacts | 629 | −7.6% |
Top-performing content
| Post | Views | Reach | Interactions |
|---|---|---|---|
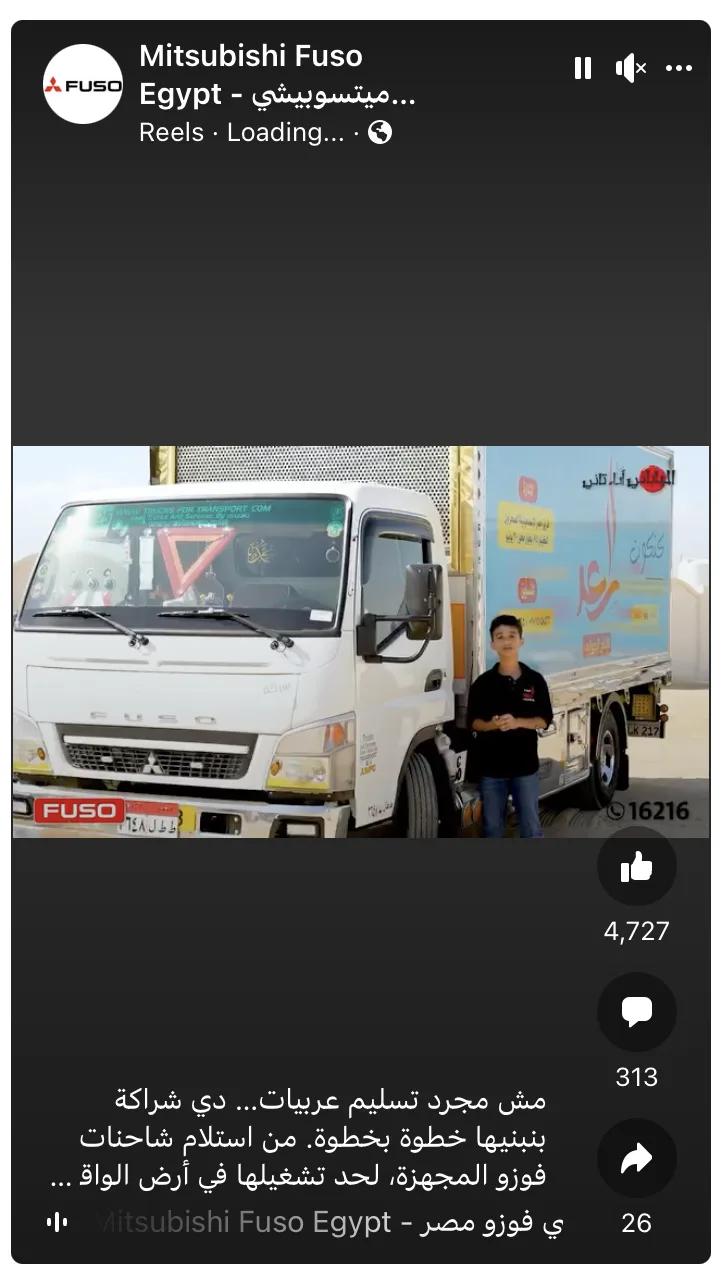
| Customer delivery / Al Saad partnership | 1.83M | 950K | 5,066 |
| FUSO × Drive campaign / giveaway | 712K | 337K | 1,361 |
| Al Saad customer testimonial | 513K | 313K | 836 |
| FUSO × Drive teaser reel | 344K | 171K | 567 |
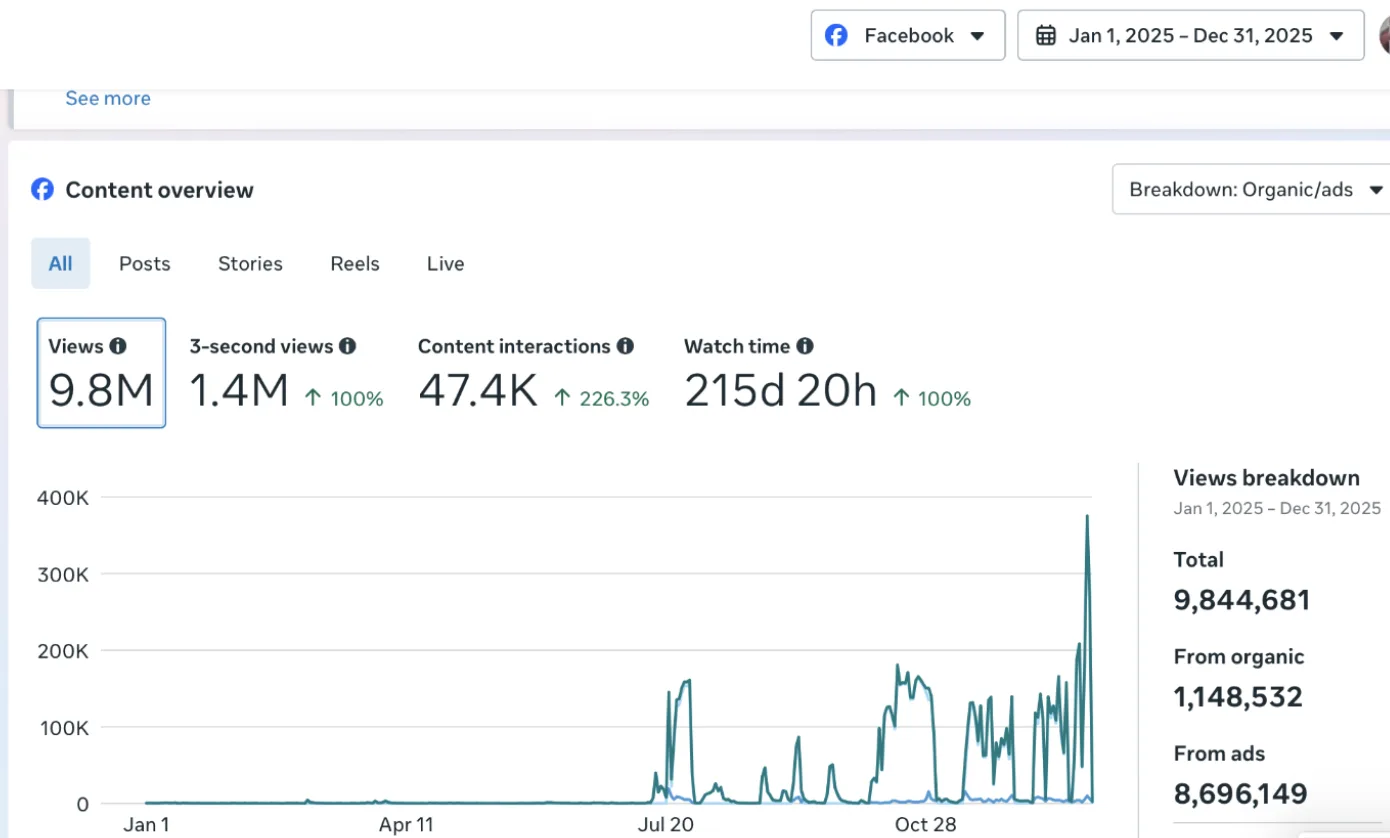
Video became the main growth driver
Reels and video content generated the strongest visibility.
Paid media played a major role
The majority of new contacts came through paid activity.
Customer engagement increased significantly
Messaging conversations grew 261.2% and new contacts 313%.
Customer-led content performed strongly
Partnership, delivery and testimonial content produced some of the highest-performing posts.
Facebook performance, 2026
Figures cover January to August 2026.
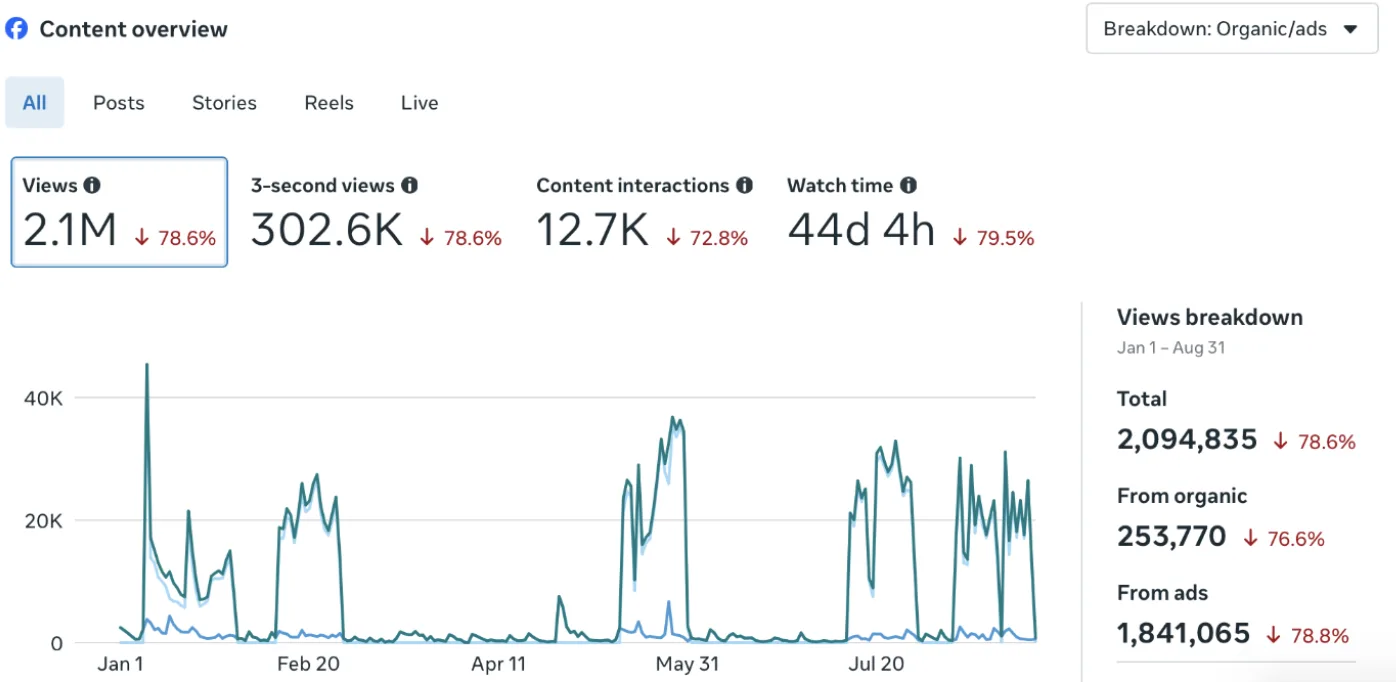
- Views2.1M
- Content interactions12.7K
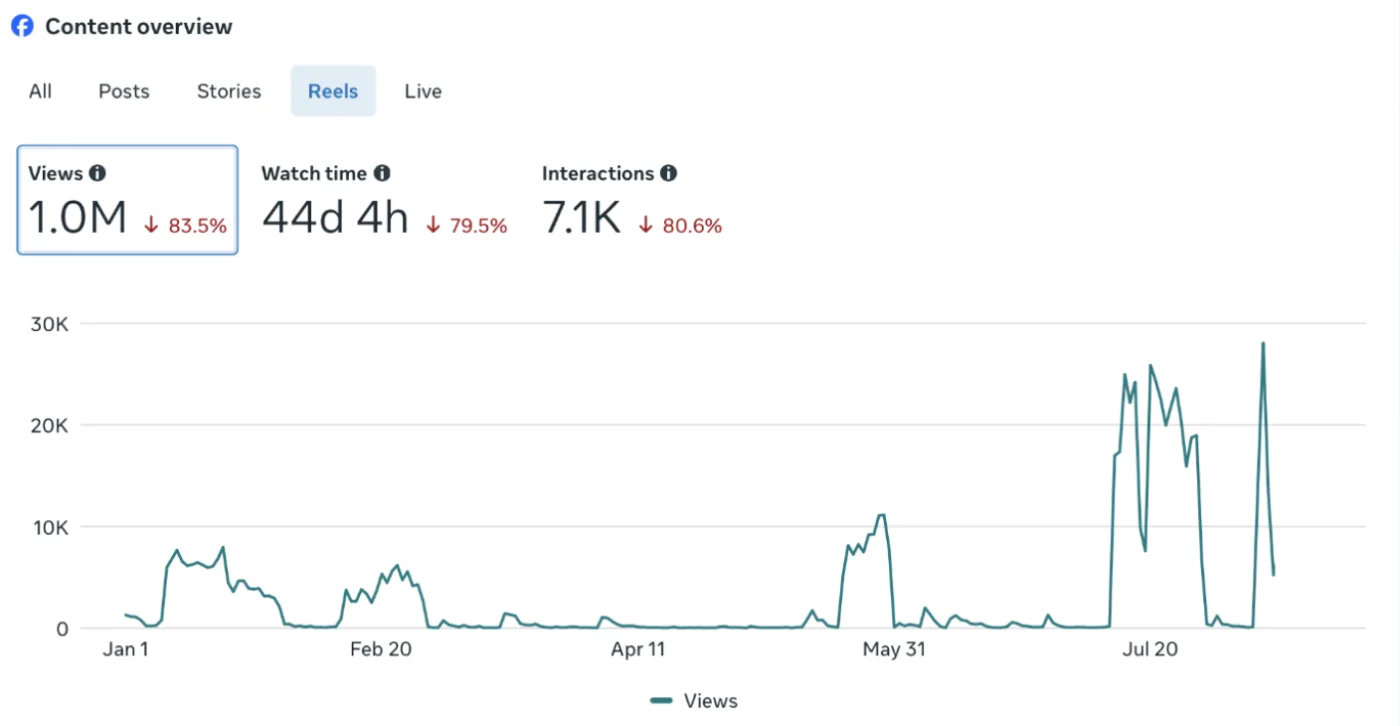
- Reels views1.0M
- Intake leads187Down 91.9%
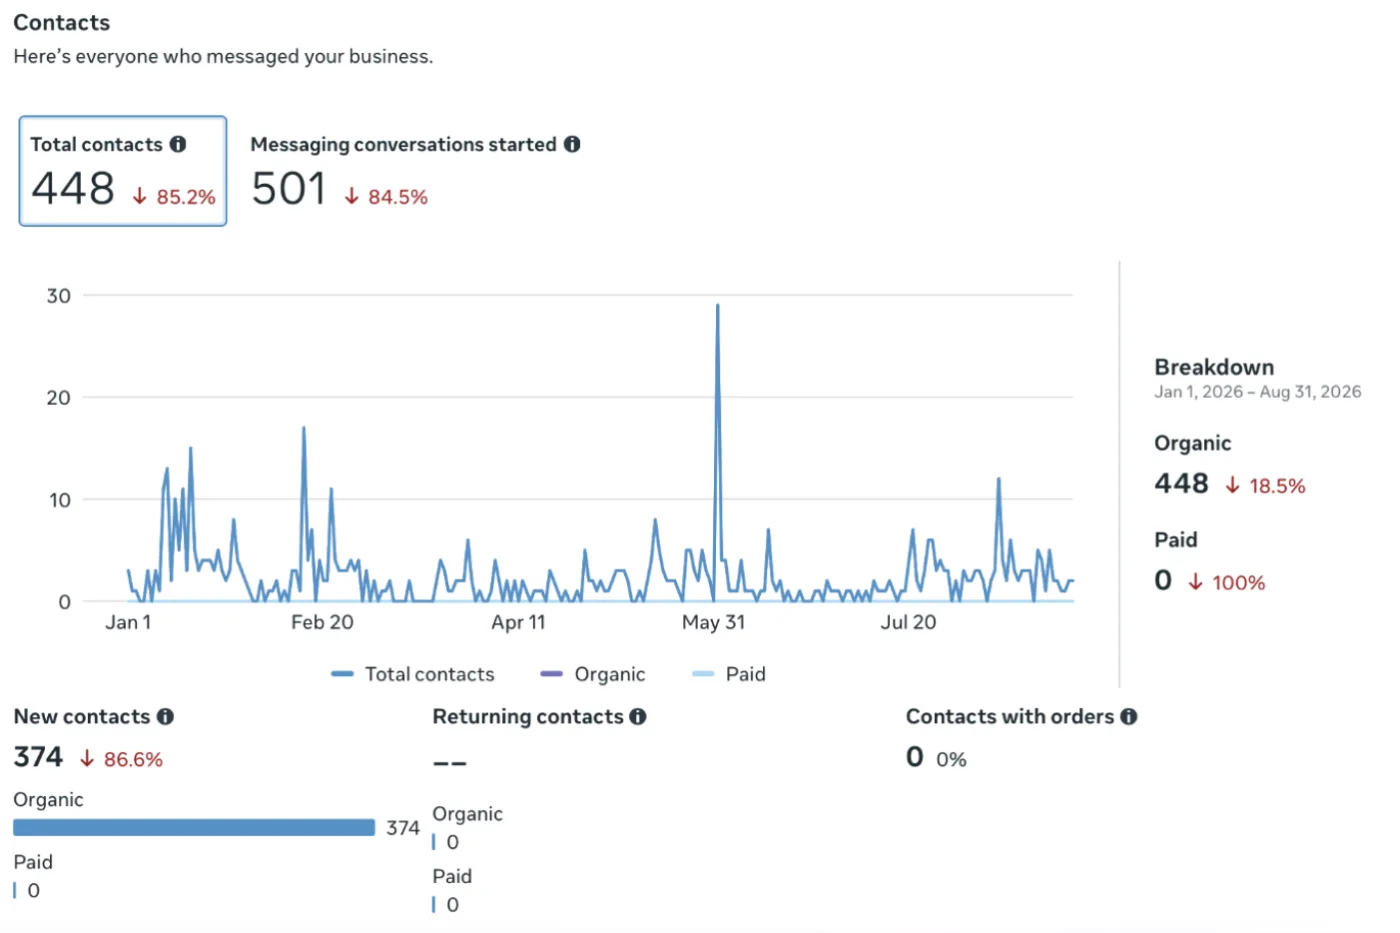
- Total contacts448Down 85.2%
- Messaging conversations501Down 84.5%
The 2026 report covers January to August. It shows a healthy content-consumption engine alongside a sharp fall in leads and conversations, and it reports that all 448 contacts were organic, with no paid contacts, in the period.
Published content
| Format | Published | Views | Interactions |
|---|---|---|---|
| Reels | 13 | 1.00M | 7.1K |
| Links | – | 567K | 2.3K |
| Photos | 22 | 214K | 1.8K |
| Multi-photo | – | 311K | 1.4K |
No Stories were published. Dashes mark counts the report does not give.
Distribution
- Views from ads1.84M
- Organic views254K
- Recent views from non-followers91.1%
Top-performing content
| Post | Views | Reach | Interactions |
|---|---|---|---|
| Driver comfort & cabin experience | 243.6K | 167.5K | 1,039 |
| Al Hejaz customer experience | 201.5K | 143.3K | 284 |
| Total cost of ownership | 176.4K | 103.5K | 844 |
| Strength & reliability | 104.9K | 78.2K | 259 |
Reels are the strongest content driver
1.0M views and 7.1K interactions, from fewer pieces than photos.
Paid distribution remains significant
1.84M of 2.09M total views came from ads.
Non-followers drive consumption
91.1% of recent views came from people who do not follow the page.
Engagement is stronger than conversion
Interactions stayed healthy, while lead and messaging volumes were significantly lower.
2025 vs 2026, like for like
The same eight-month window in both years, so the comparison is like for like.
| KPI | Jan–Aug 2025 | Jan–Aug 2026 | Change |
|---|---|---|---|
| Views | 1.67M | 2.09M | +25.2% |
| Content interactions | 8.46K | 12.67K | +49.9% |
| Facebook follows | 1.14K | 15.98K | +1,303% |
| Facebook visits | 29.25K | 35.92K | +22.8% |
Measured over the same eight months in both years, follower growth was the biggest improvement, followed by content interactions, which grew faster than views.
Audience
- Facebook followers (2026)96,997
- Men87.9%
- Women12.1%
Facebook’s audience is predominantly male. The 35–44 group is the largest segment, followed by 25–34 and 45–54, a mature, commercially relevant audience. On TikTok the audience is also predominantly Egyptian and male (87%), with the strongest concentration among users aged 25–44.
YouTube and TikTok
YouTube
| 2025 | 2026 | |
|---|---|---|
| Views | 2.1K | 2.8K ↑69% |
| Watch time | 7.7 h | 9.2 h ↑49% |
| Subscribers gained | +12 | +10 ↓9% |
| Shorts share of views | 69.7% | 79.5% |
| Thumbnail CTR | 4.4% | 4.7% |
Shorts generated the majority of channel views. In 2025, YouTube search drove 75.7% of discovery and 95.7% of viewers were new; only four videos were published that year.
TikTok · 2026
- Video views2.8M
- Likes26.8K
- Shares636
- Followers20K
The most-viewed video, truck and driver-focused content, reached 1.5M views. Visibility comes overwhelmingly from the For You feed (98.4%), and 83.6% of the audience is in Egypt.
Final takeaway
2025 marked a clear shift toward performance-led social communication, where video, paid media, lead generation and customer-focused storytelling became major growth drivers. 2026 shows a strong content-consumption engine, but a clear opportunity remains to convert audience attention into leads and customer conversations.
Summary from the FUSO Egypt report