All projects

Project 04 · Community & Social Media Performance

Fixology

A monthly community report for Fixology, an automotive services brand, covering its Facebook and Instagram pages: month-over-month performance, audience profile and the content behind the month.

Brand
Fixology
Report
Community report · May 2026
Platforms
Facebook, Instagram
Content
5 posts published in May on each platform

Main findings

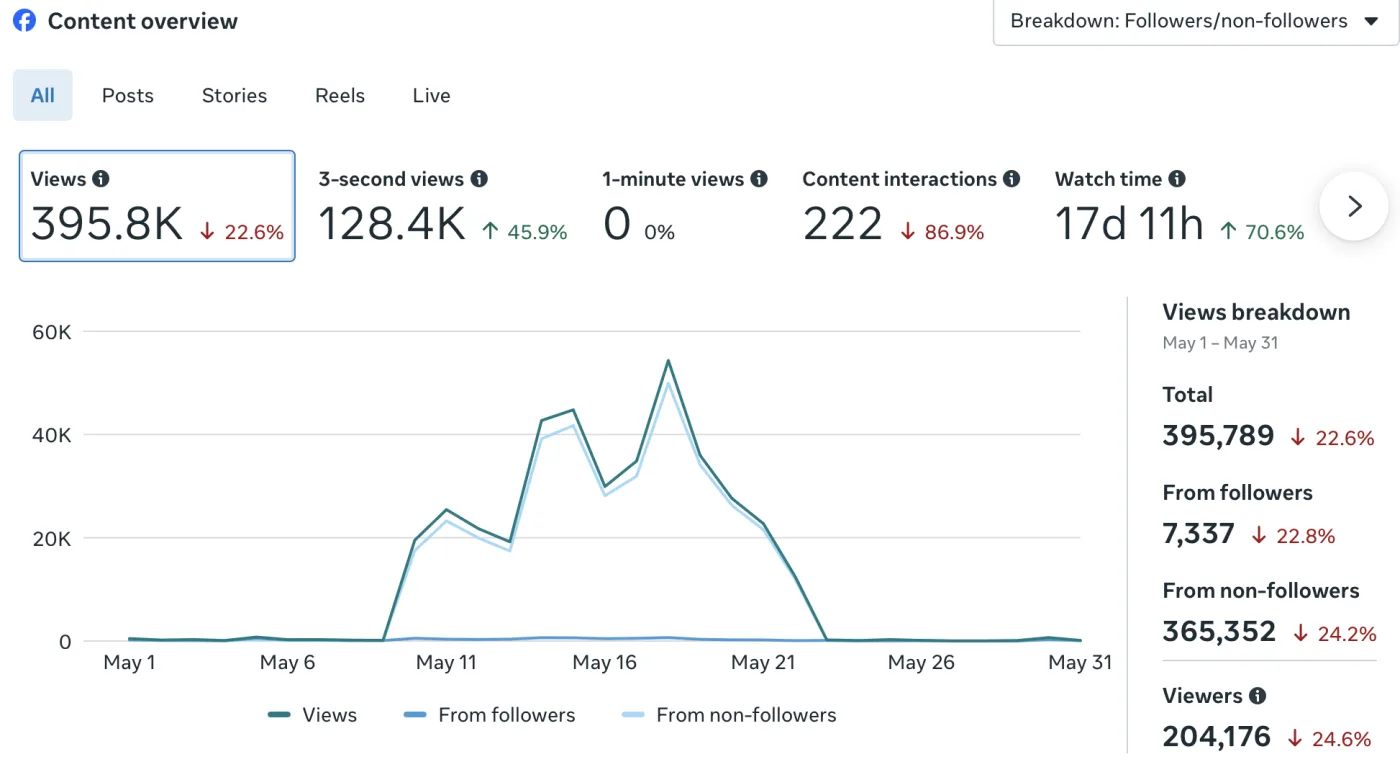
  • Facebook views, May 2026395.8KDown 22.6%
  • Facebook content interactions222Down 86.9%
  • Facebook followers, May 202656,697
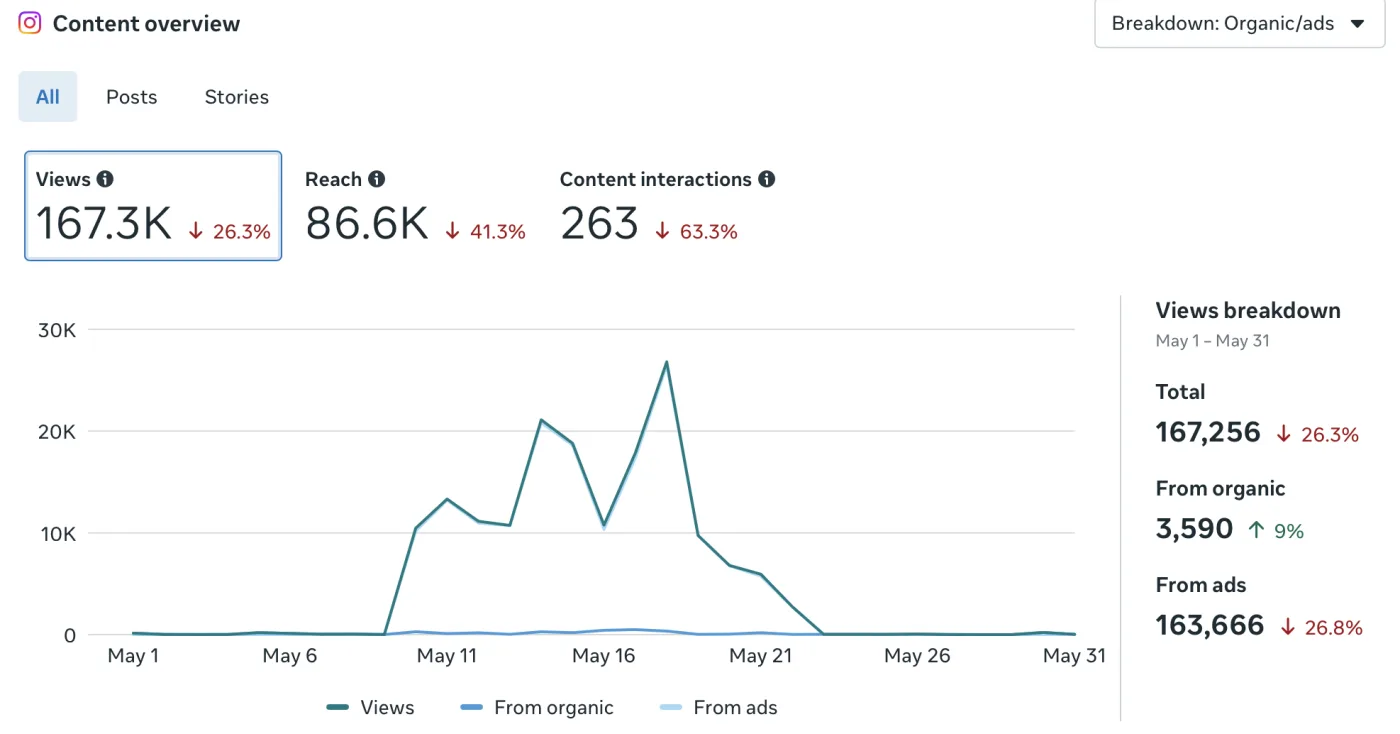
  • Instagram views, May 2026167.3KDown 26.3%

Overview

Each month the report pulls Facebook and Instagram figures into one view: a month-by-month comparison, the community numbers (followers, audience demographics), an account summary and the top-performing posts. Content is aimed at an Egyptian audience and promotes Fixology’s car services.

The May report is a candid one: views held up far better than interactions, with nearly all visibility coming from people who do not follow the page.

Month-by-month comparison · Facebook

Facebook, April vs May 2026
MetricApril 2026May 2026Change
Views511,257395,789−22.6%
Content interactions1,698222−86.9%
Followers56,72556,697−28 net
  • Views, May395.8K
  • 3-second views128.4KUp 45.9%
  • Watch time17d 11hUp 70.6%
  • Viewers204,176Down 24.6%

Percentage changes are from the Meta report.

Instagram · May 2026

  • Views167.3KDown 26.3%
  • Reach86.6KDown 41.3%
  • Content interactions263Down 63.3%
  • Followers2,424

Instagram views came almost entirely through ads: 163,666 of 167,256 views, against 3,590 organic, which were up 9% on the month.

Audience

Facebook

  • Men89.6%
  • Egypt91.9%
  • Cairo34.4%

Saudi Arabia (4.4%) and the UAE (1.8%) follow Egypt. The largest segments are men aged 25–34 (41.1%) and 35–44 (29.6%).

Instagram

  • Men83.3%
  • Egypt92.4%
  • Cairo41%

Men aged 25–34 (30.8%) and 35–44 (29.7%) are again the largest groups.

Content behind the numbers

Five posts were published on each platform in May. Two posts from the report’s top-performing content are shown here: a before-and-after headlight restoration video, and a post about electric tailgate assist for Changan and Tiggo vehicles, both with a way to get in touch.


Key insights

  1. Reach came from outside the follower base

    Of 395,789 Facebook views, 365,352 came from non-followers and 7,337 from followers.

  2. Attention was concentrated

    Views peaked in mid-to-late May and were close to zero on other days.

  3. Watching deepened while volume fell

    3-second views rose 45.9% and watch time 70.6%, even as total views fell 22.6%.

  4. Interactions and followers did not follow

    Content interactions fell 86.9% and the follower count was flat (−28 net).

The report’s learnings and recommendations page is not filled in, so the insights above are drawn directly from the figures.